Solar Panel Degradation
& Lifespan Visualiser
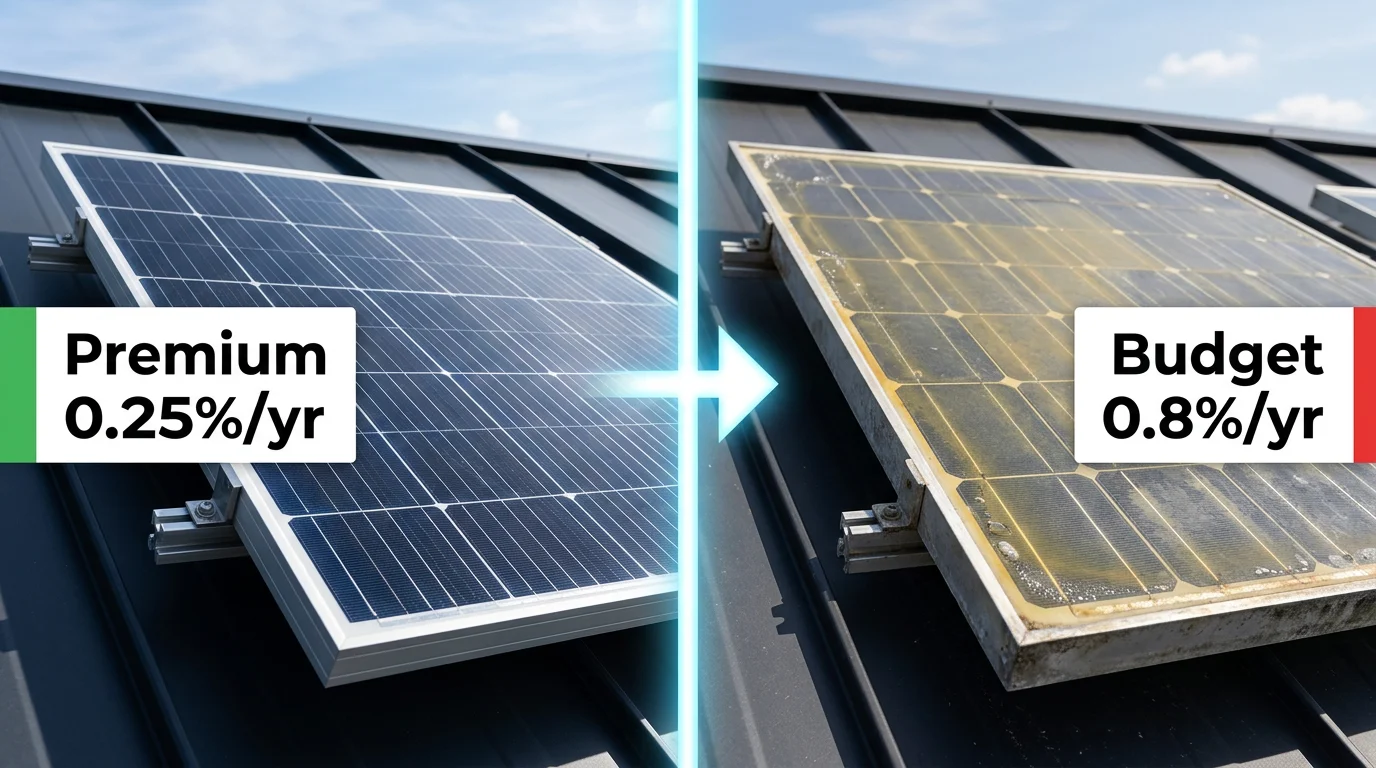
Cheap solar panels look the same on your roof — but they silently lose more power every year. See exactly how much energy (and money) the quality difference costs over 30 years, and why your installer's choice of panel matters enormously.
Panel Degradation & Lifespan Visualiser
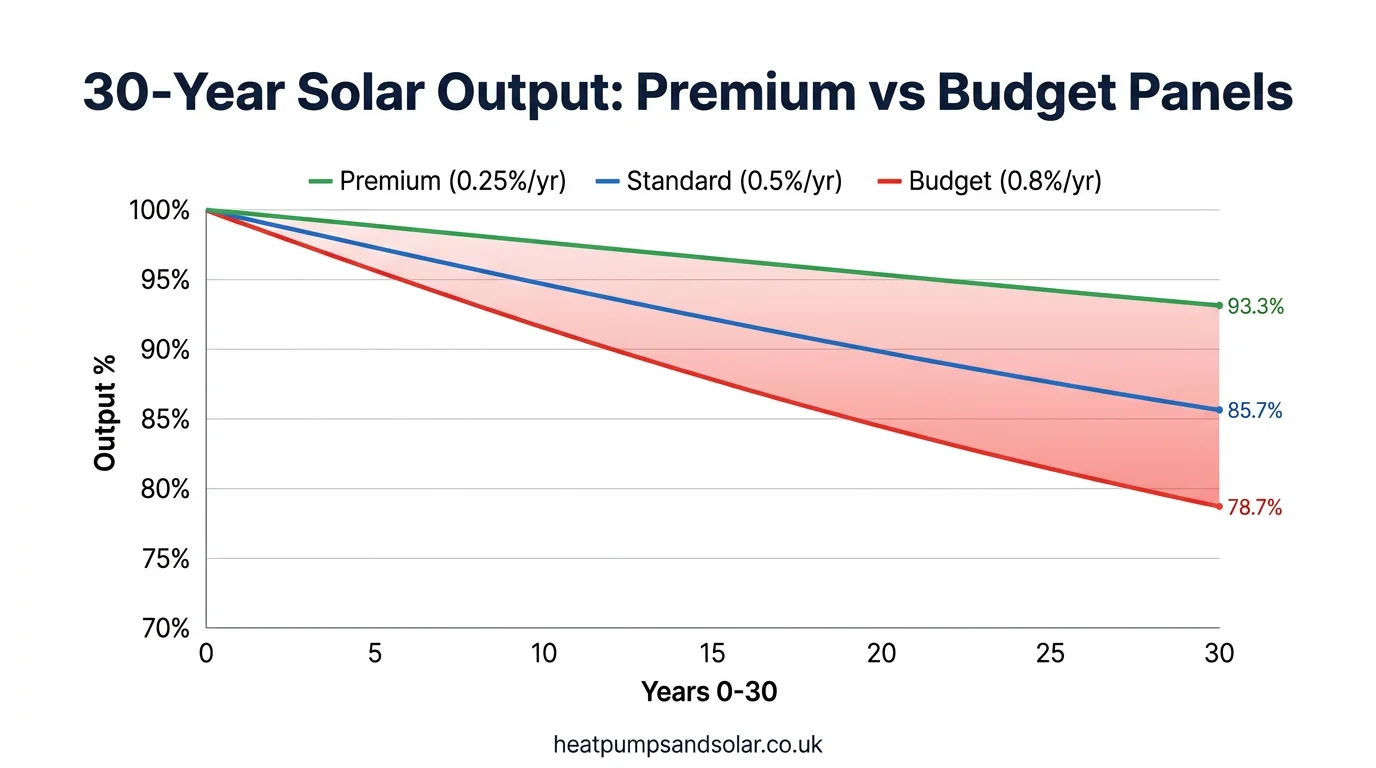
See how panel quality affects 30-year output — and what it costs you
Premium panels pay for themselves: Despite costing £1,200 more upfront, premium panels generate an estimated £4,264 more electricity value over 30 years — a net gain of £3,064 versus budget.
Always ask your installer for panel brand, model, and degradation warranty in writing.
Demand Written Warranty
Always ask for the warranted degradation rate in writing — not just a verbal assurance. Reputable manufacturers publish linear performance warranties (e.g., "84.8% at Year 25"). If your installer cannot provide this document, that is a red flag.
N-Type vs P-Type Silicon
Premium N-type panels (HJT, TOPCon, IBC) are virtually immune to LID because they use boron-free silicon. They degrade at 0.25–0.3%/yr vs 0.5–0.8%/yr for standard P-type PERC cells — the same fundamental reason high-spec silicon wafers cost more.
Manufacturer Longevity Risk
A 25-year warranty is only as good as the company behind it. Stick to brands with established UK distribution and parent-company backing. Grey-market panels from unknown manufacturers carry serious warranty enforcement risk — who will you call in Year 14?
Panel Quality Comparison: What the Specs Really Mean
The key specifications to compare when evaluating solar panel quotes in the UK.
| Specification | Premium | Standard | Budget |
|---|---|---|---|
| First-year LID loss | 0.3–0.5% | 0.8–1.2% | 1.5–2.5% |
| Annual degradation | 0.25–0.30%/yr | 0.45–0.55%/yr | 0.7–1.0%/yr |
| Year 25 output (warranted) | ≥ 92% | ≥ 84.8% | Often unspecified |
| Cell technology | N-type (HJT / TOPCon / IBC) | P-type PERC / PERC+ | P-type BSF / unknown |
| Manufacturer warranty | 25 yr product + linear perf | 25 yr product + linear perf | Often 10 yr or none |
| UK warranty enforcement | Major brands with UK offices | Most have UK distributors | Often impossible |
| Typical UK examples | REC, Panasonic, SunPower | Longi, JA Solar, Jinko, Canadian | Grey market / unknown origin |
The Hidden Cost of Cheap Panels: A Real Example
Scenario: 4 kWp installation, South East England
Two identical quotes arrive for the same 4 kWp system. Quote A uses REC Alpha panels at £8,400. Quote B uses unbranded panels at £7,200. The homeowner picks Quote B to save £1,200.
The verdict: The homeowner saved £1,200 upfront but lost an estimated £2,800 in lifetime energy value — a net loss of £1,600. And that's before considering the likely failure to enforce warranty claims on grey-market stock.
3 Questions to Ask Every Installer
Accept nothing above 0.55%/year. Demand the manufacturer's written linear performance warranty document — not a verbal promise.
N-type (HJT, TOPCon, IBC) panels resist LID and degrade more slowly. P-type PERC is acceptable from reputable brands; unbranded PERC is higher risk.
The installer should be able to name the UK distributor or manufacturer warranty contact. If they cannot, that is a serious red flag about the product's provenance.
MCS-certified installers use approved products — protecting you from grey-market panel risk.
Explore More Solar Tools
Check your solar quote for 16 red flags — including unbranded panels and warranty gaps — before you sign anything.
Inverter quality affects more than output. Discover the hidden standby consumption that quietly drains your battery overnight.
Panel quality also matters at end-of-life. See UK solar panel waste projections to 2050 and the recycling gap that needs to close.